
Nine months ago, as the coronavirus-related lockdowns and slowdowns were reaching their peak, we made some predictions (for High Country News and here) regarding how the pandemic and efforts to slow its spread might affect the energy world. We’re certainly not out of the woods yet — another wave of infections is expected this fall and winter — but we’ve now been in the grips of this thing long enough to get a better sense of how it has, and has not, hampered consumption and production of energy.
As expected, energy consumption across the board decreased this spring, as the strictest infection-prevention measures were put in place. Electricity use dropped as office buildings and other businesses went dark, and oil consumption plummeted as folks curbed flying and commuting. These changes reverberated throughout the energy sector in a variety of ways.
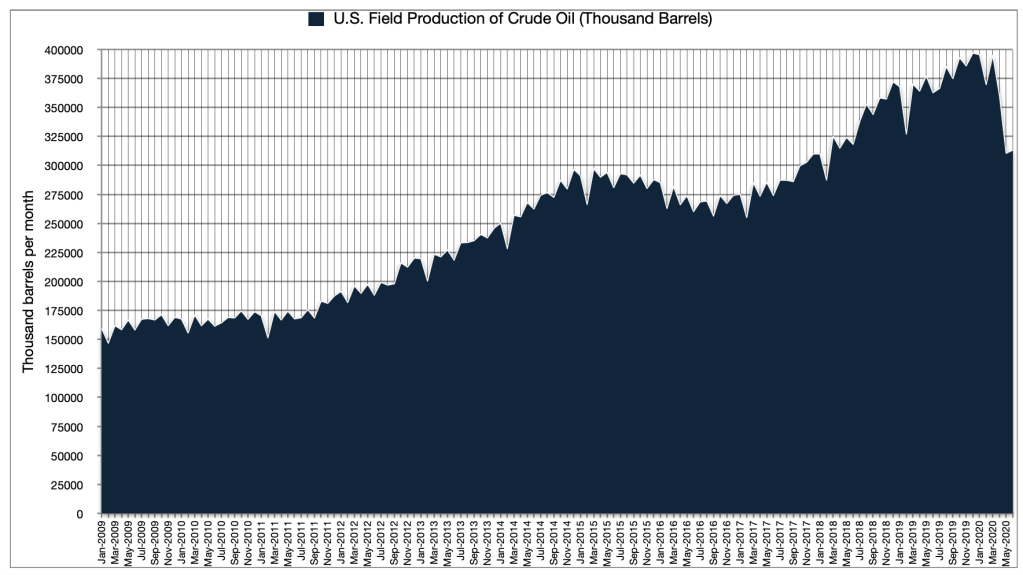
Oil seems to have suffered the most lasting consequences. Petroleum is a global commodity, meaning that it is propelled by the winds of supply and demand on the international level. China is the world’s second largest consumer of oil, after the United States, so when China first began locking down in the early days of 2020, it rippled through the global market, sending prices in a downward spiral. On the last day of 2019, the West Texas Intermediate price — the U.S. benchmark for a barrel of crude — hit $63, higher than it had been in eight months. A month later it was down to $50, and by late April, after dipping into negative territory, it stabilized at around $17 per barrel. As businesses re-opened and the economy started churning again, the price shot back up to about $40 in early June, giving the oil industry hope. It hasn’t budged from there, since, however, and that’s not high enough to make most drilling profitable.
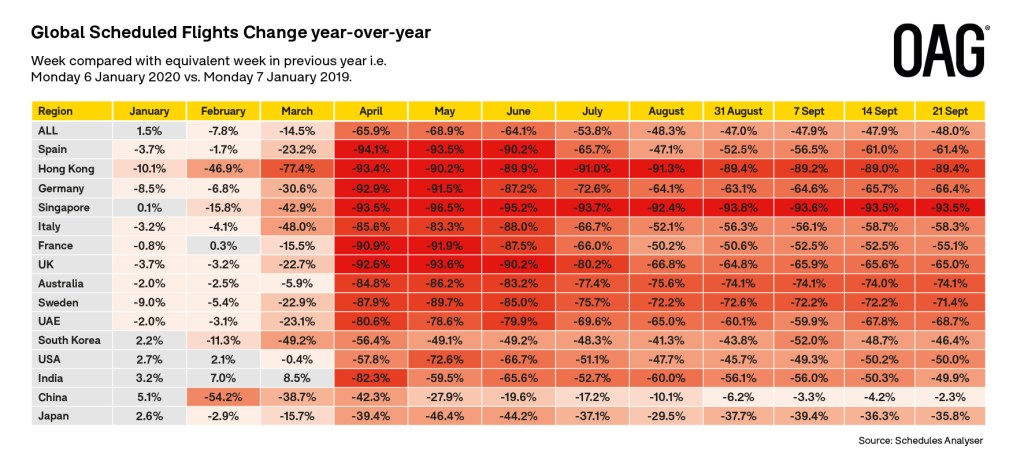
One of the main drivers of the consumption decrease has been aviation. People stopped flying early this year, and with a number of travel bans in place, they are continuing to avoid airports and airplanes.
Prices drive drilling, and drilling activity, as indicated by the active rig count, has crashed over the last nine months.
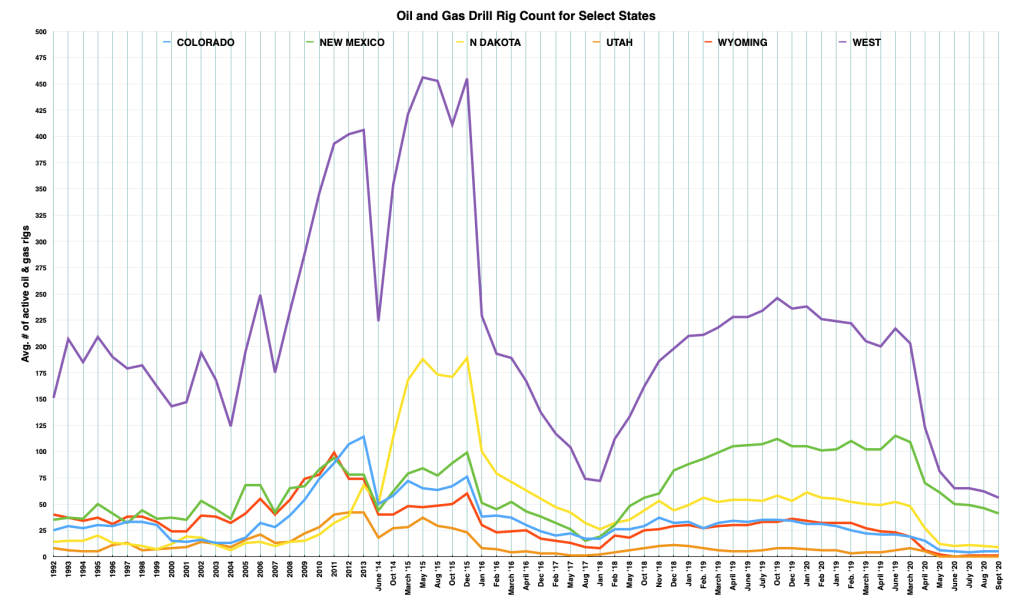
It’s important to note that the rig count only applies to wells being drilled at the time of the count and not existing, producing wells, most of which continue to produce until prices get so low that oil companies plug the wells to stop losing money on them. It’s also worth noting that all oil and gas wells experience something called the decline curve. During the first weeks after they are first drilled and completed, the wells produce at a high rate, which lessens over time. That is, a new well might produce 200 barrels of oil per day during the first month, 150 barrels the second month, 100 the third, and so forth. The decline curve is especially steep for the newer horizontal, multi-stage fracked wells, which means that in order to keep overall production from a field stable, you continuously have to drill new wells. Once you slow down drilling, production will drop, as well, even if none of the existing wells are plugged.
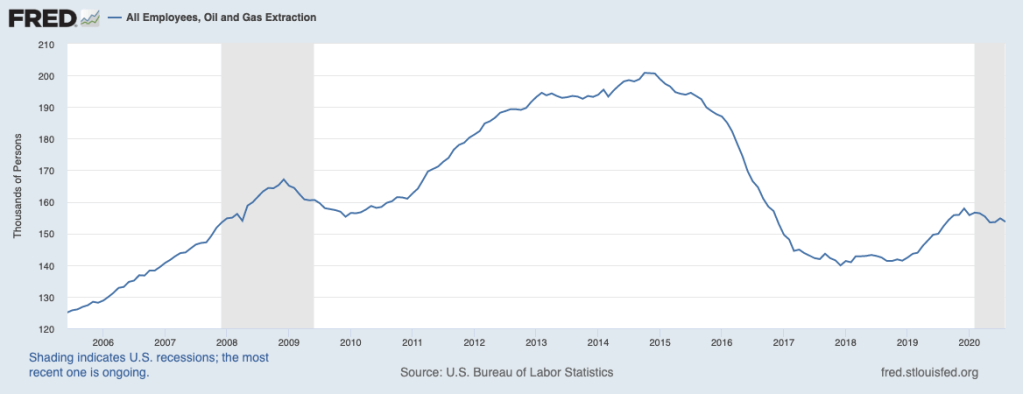
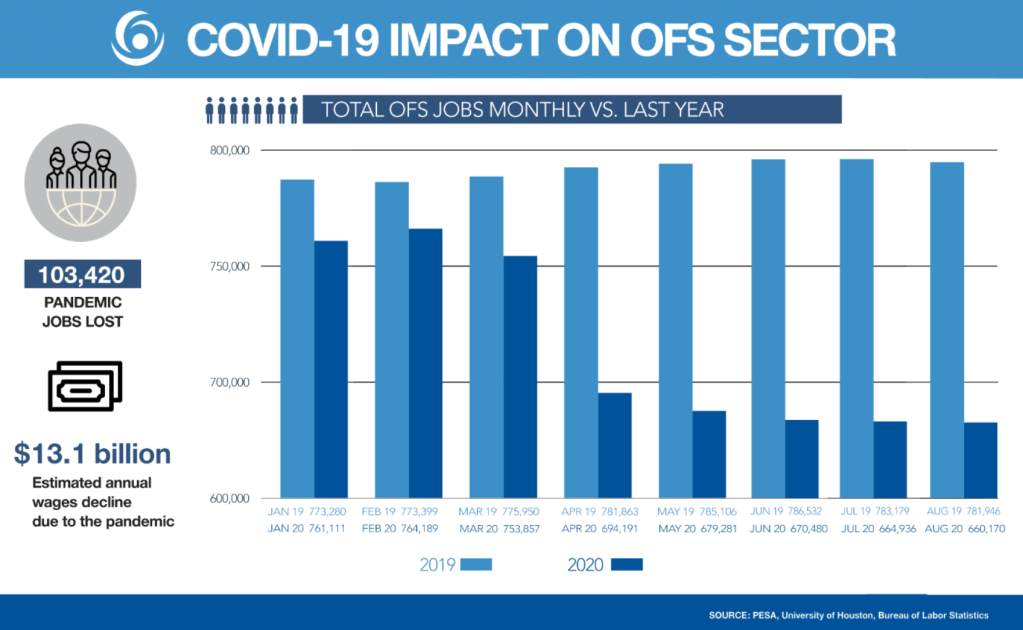
The drilling phase of oil and gas extraction is the most labor intensive (a rig can employ 50 people or more, while a producing well only provides about five jobs), so when the rig count crashes, so does employment in the oil and gas fields.
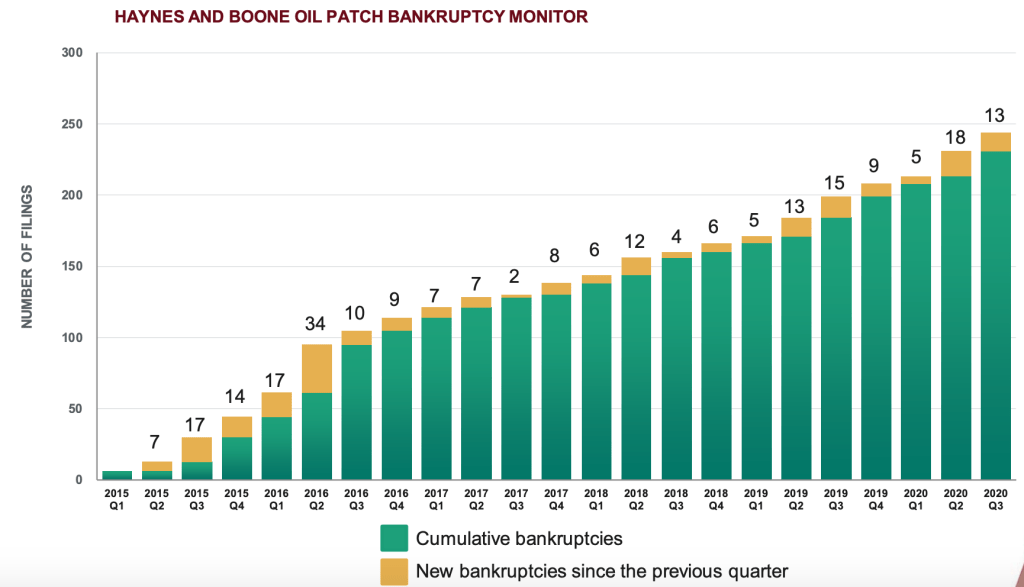
The oil and gas industry wasn’t in such great shape before the pandemic hit. Many of the companies were saddled with debt that was about to come due. Coronavirus drove a number of those companies into the red.
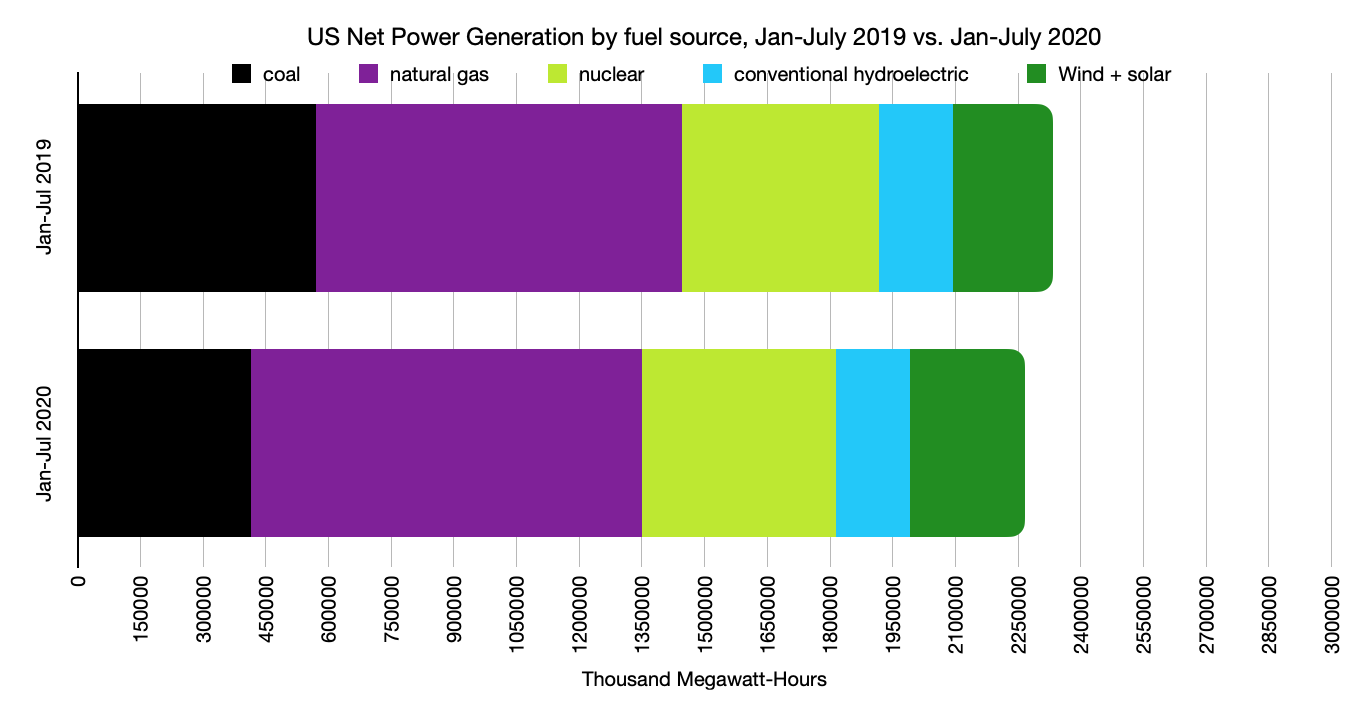
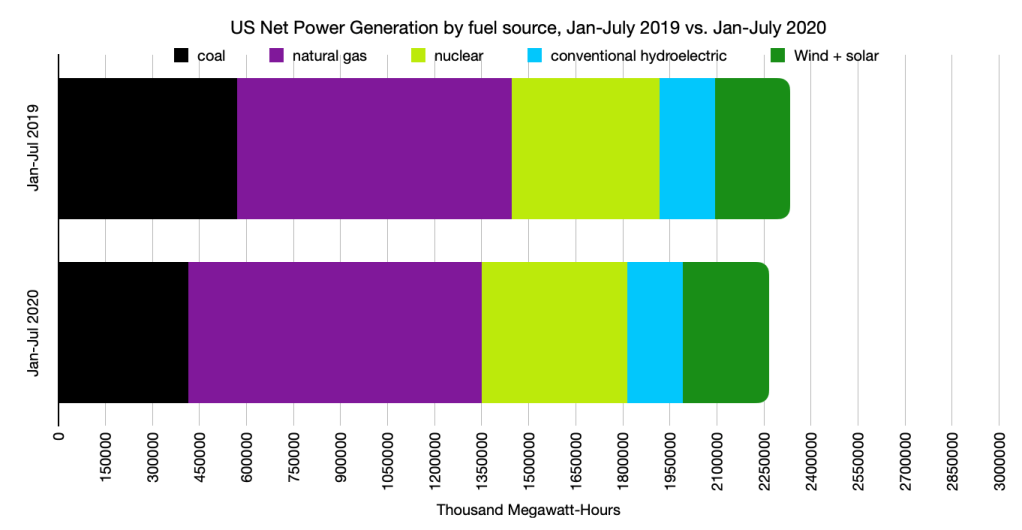
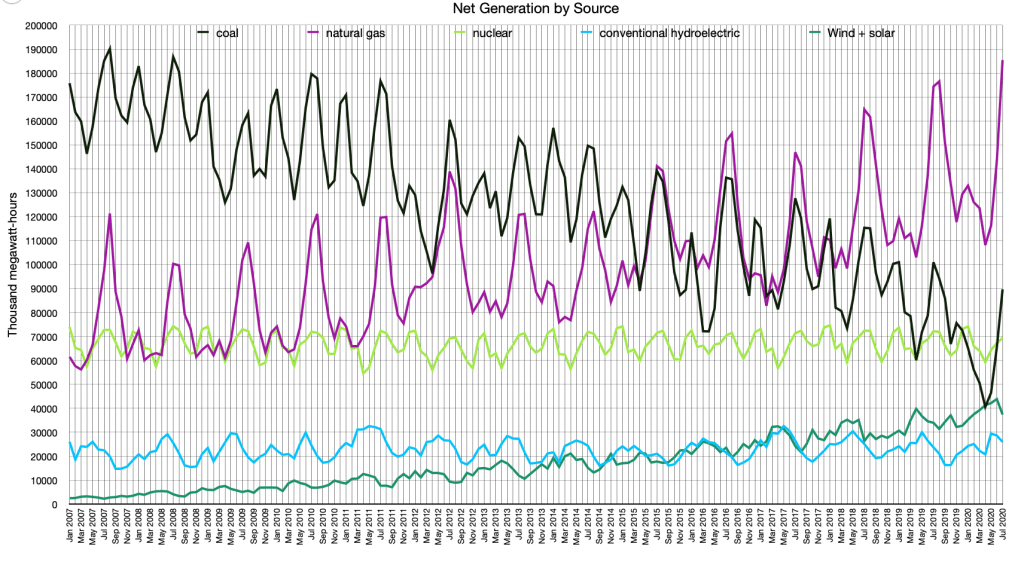
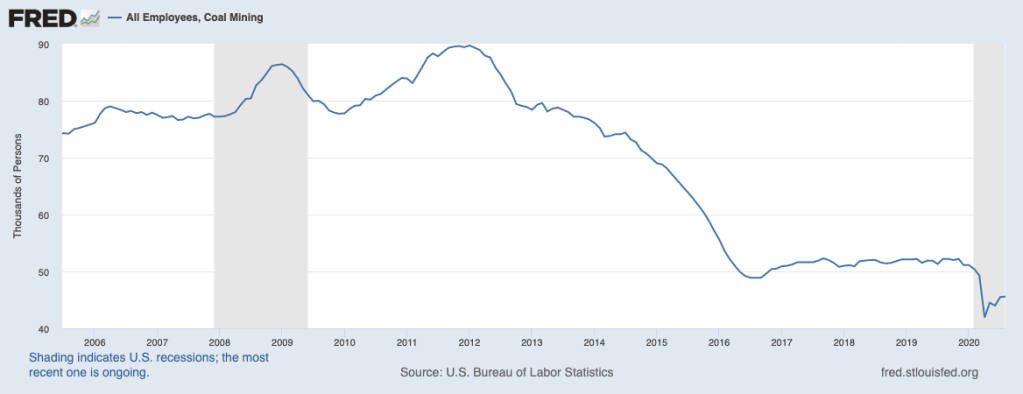
COVID-19’s impact on the electricity sector has been a little more nuanced, but significant nonetheless, particularly when it comes to coal consumption. During the first seven months of 2020, Americans used 3 percent less electricity than they did during those same seven months in 2019, in spite of the fact that many parts of the country experienced their hottest summers on record (air conditioners guzzle electricity). Most of the reduction came in April, when there was a 7 percent decrease in electricity use and a whopping 30 percent reduction in coal consumption for electricity generation.
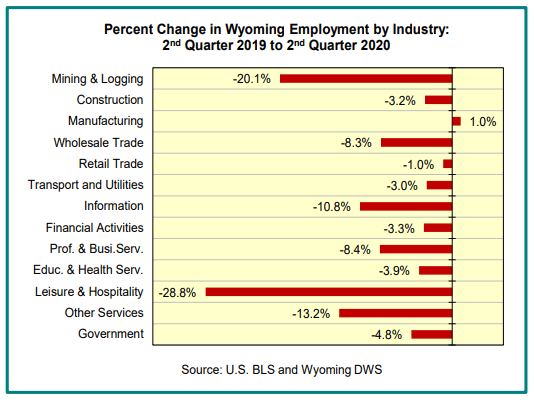
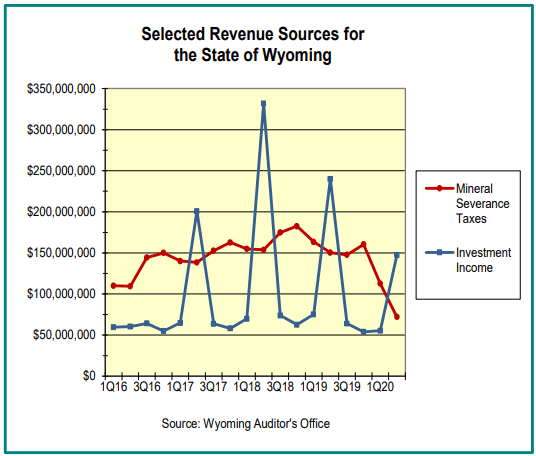
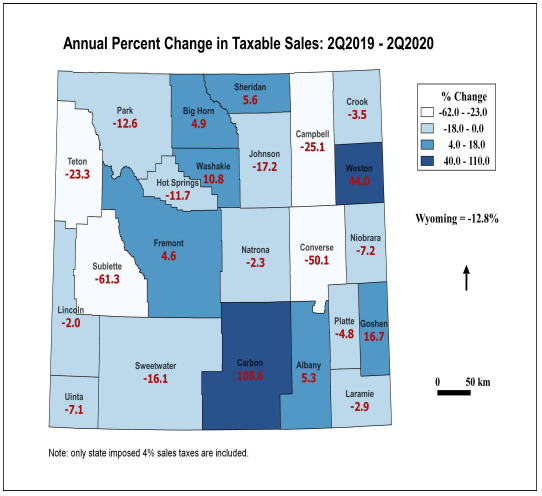
Wyoming has been pummeled by the coronavirus, mainly because its economy is so dependent on coal and oil, as well as tourism, which also took a beating.
But it isn’t all doom and gloom in Wyoming. Notice in the map below that the coal and oil and gas-heavy counties such as Campbell County, Converse, and Sweetwater are suffering, along with tourism-based places like Teton County. And Sublette County, which has a combination of natural gas drilling and tourism, is hurting worst of all. But Carbon County is doing quite well. Why? Because some very large wind power projects are being built in Carbon County, providing one of the state’s only economic bright spots. Who knows, they may even
###

Jonathan P. Thompson is the author of River of Lost Souls: The Science, Politics, and Greed Behind the Gold King Mine Disaster (Torrey House, 2018), and the recently published novel, Behind the Slickrock Curtain (Lost Souls Press, 2020).
Images and articles on this site are available for reprint, with permission only, and Thompson is available to do freelance work and is now looking for permanent work in the American Southwest. Contact him at Jonathan@RiverOfLostSouls.com for details.
