
“For the first time in fourteen years, San Juan County celebrated Christmas and New Year’s days without any snow on her streets, and with very little snow within the county.” That was the front-page news a century ago this month for the Silverton Standard newspaper in the high San Juan Mountains of southwestern Colorado.
This January, the news was pretty much the same: Virtually no snow in the town of Silverton, located at 9,318 feet elevation, and only a scant amount on the much higher mountains surrounding it. This in a town that gets, on average, more than 150 inches of snow per year; where, in 1993, more than seven feet of snow fell in February, alone. So it’s no surprise that photos of snowless streets and brown hillsides, of people mountain biking the high country instead of skiing, have proliferated on social media. They are accompanied by comments expressing alarm over this unprecedented dryness, a signal that the climate change apocalypse is upon us. Contrarian codgers then glance up from their easy chairs with assurances that global warming is a hoax, that this is normal, and that ’76-’77 or ’58-‘59 were far worse.
As the above newspaper clip shows, this year’s dire situation has precedents. In 1918, Silverton held a New Year’s parade on the main drag, hosted a baseball tournament and had fishing outings. In 1904 a water wagon had to spray the dry streets to keep the dust down. In 1878-79 there was so little snow in February that miners were getting buried by rock slides rather than avalanches, and the following summer 20,000 acres of high altitude forest burned between Durango and Silverton. And, yes, 1977 was grim, 1959 even more so.
But normal this is not. The combined San Juan Mountain snowpack, which fuels the flows in the Animas, San Juan, Dolores, Gunnison and Rio Grande rivers, is sitting right around 25 percent of the median level, while the entire state of Colorado is at about 54 percent. There was more snow on the ground in January 2002 — one of the worst drought years on record — than there is now.
Wanting to get a more localized look at what’s going on, I checked out the data at the SNOTEL stations on Molas and Red Mountain passes, to the south and north of Silverton, respectively. Both stations, which measure snow water equivalent, are much higher in elevation than Silverton, and typically receive considerably more snow. The Red Mountain station’s data go back to 1981; the Molas station began recording in 1987. I graphed the monthly stats for the seven winters that had the lowest numbers for Jan. 1, and also threw in 2002 since it was extraordinarily dry. Click on the images for a larger view.
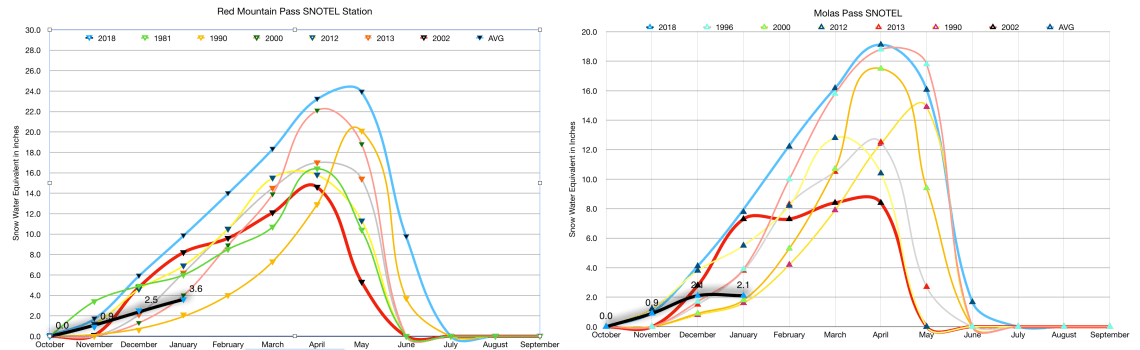
Here’s some of what the data show:
- The snowpack thus far for the 2018 water year sucks. As of Jan. 1 it was at less than half of average for the period of record.
- However, this year’s suckiness is not unprecedented, even in more recent times: The 1990 water year (Oct. 1, 1989-Oct. 1, 1990) was even worse at this point, and 2000 was about the same as this year.
- Snowpack for the 2002 water year, which would turn out to be the driest year on record in Southwestern Colorado, was actually tracking at about average as of the beginning of January. The drought didn’t really hit until the later, usually more abundant part of winter, leaving the region desiccated and aflame.
- All is not lost, yet. The 1990 water year started out terribly, but some big snows later in the winter brought the pre-spring runoff snowpack to close-to-average levels. Even as I write this, at the end of the first week of January, a storm is settling into the San Juans.
So while the current snow situation in the San Juans is alarming, we probably shouldn’t trade in our skis for swimsuits based on the snowless peaks, alone.
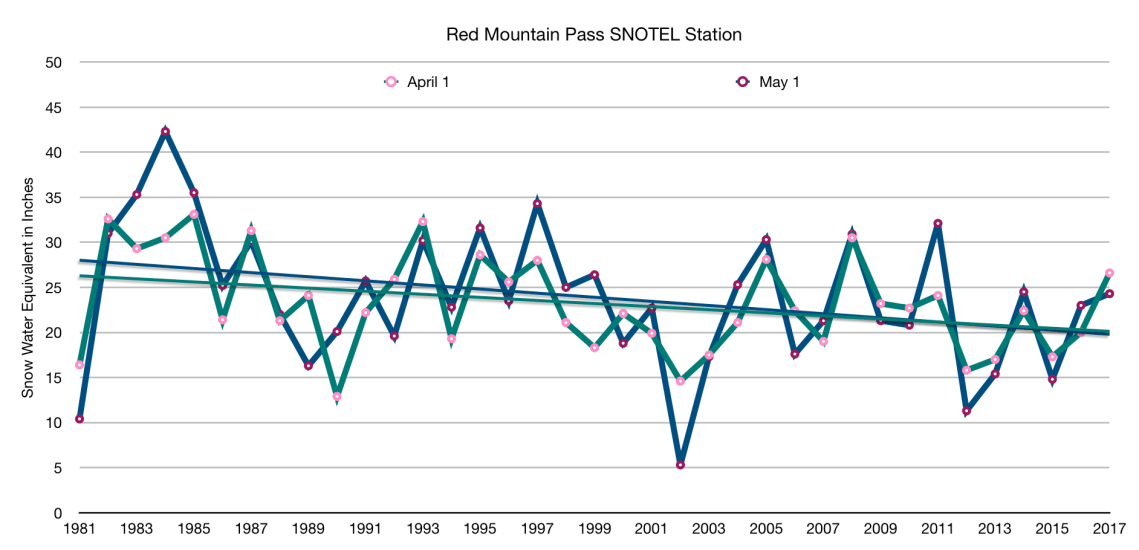
Look a little deeper at the data, however, and you can find plenty of reasons to worry. Check out these graphs of snowpack levels in April and May — when snow cover typically peaks — for both stations. On the one hand, there’s reason to take heart: Meagre winters are quite often followed by bountiful ones, and vice versa. On the other hand, see the trend lines? They’re going down.

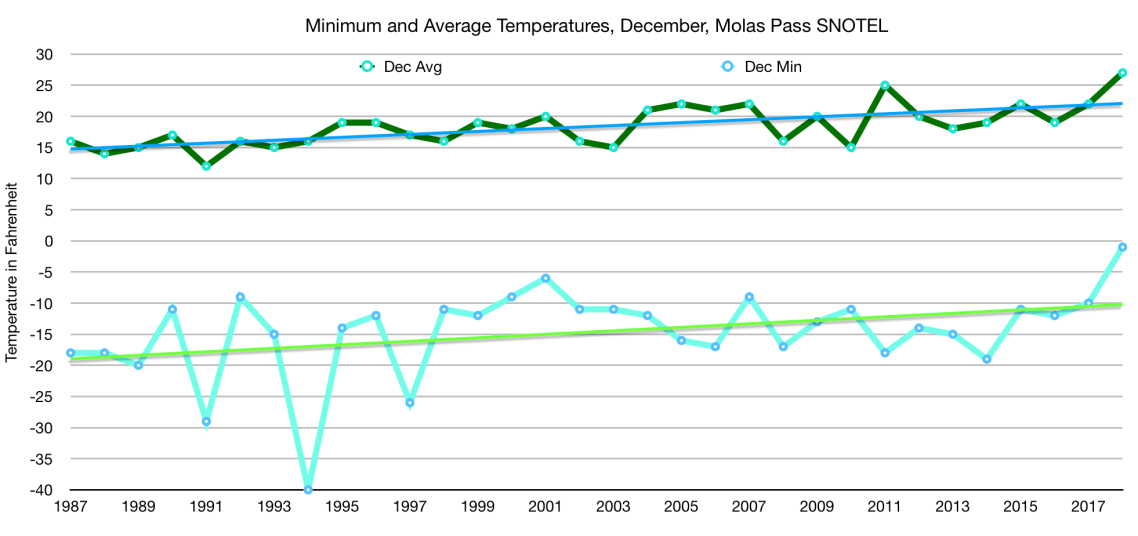
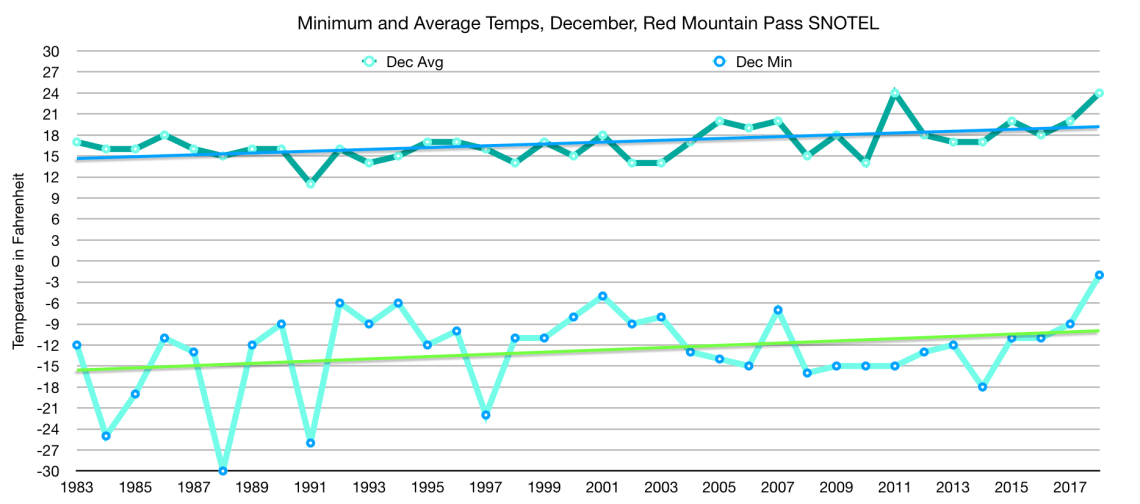
And here’s a graph showing average and minimum temperatures for December (so as to include this year’s data) at both stations. This time the trend line is tilted upward, with this December being the warmest of all. Show that to your friend who insists that recent winters are as cold and snowy as ever.
The diminishing snowpack and rising temperature trends jive with USGS streamflow records, which show that the Animas River’s flow has diminished over the years.
There are caveats to all of this: These are just two stations, and aren’t necessarily a reflection of the region’s climate as a whole; the period of record is probably too short to know what’s really going on in the long term; and some of the temperature data points were missing or seemed glitchy.

1 Comment