The U.S. Department of Interior recently sent out a flurry of press releases announcing a major upswing in energy development on federal lands. “Energy Revenues and Disbursements Soar Under The Trump Administration,” one said, adding that the revenues from energy development on federal land were “nearly double the disbursements allocated at the end of the previous Administration.”
The public relations blitz is clearly intended to tout the administration’s “energy dominance” agenda — as well as perhaps taking some attention away from its numerous scandals. The administration is claiming that by rolling back environmental protections and rules that protect public health and worker safety, it is responsible for sparking a “drilling surge,” as one media outlet described it. And that, in turn, is giving a boost to communities in the oil and gas patches.
The last three years of data do, indeed, show that oil and gas leasing, drilling, and production have seen an increase under Trump. A longer view reveals a more nuanced picture, however, and shows:
The current “drilling surge” is a limited one, occurring primarily in the Permian Basin in southeastern New Mexico and Texas.
There is far less drilling activity Westwide now than there was five years ago.
A surge in oil and gas leasing does not necessarily lead to a surge in drilling permits, and a surge in drilling permits does not necessarily lead to a surge in actual drilling. Companies will sit on leases for years without applying for a permit to drill. And over the past decade federal land managers issues some 37,000 permits to drill, but drilling was begun on only 23,000 wells during that time.
Energy revenues overall remain lower now than they were six years ago, meaning that if any president can claim “energy dominance” it would be President Barack Obama. Which is to say, no president can really make such a claim. Total revenues are a product of price and production.
Most importantly, the data show once again that the price of oil and gas, not environmental regulations, drive the pace of drilling.
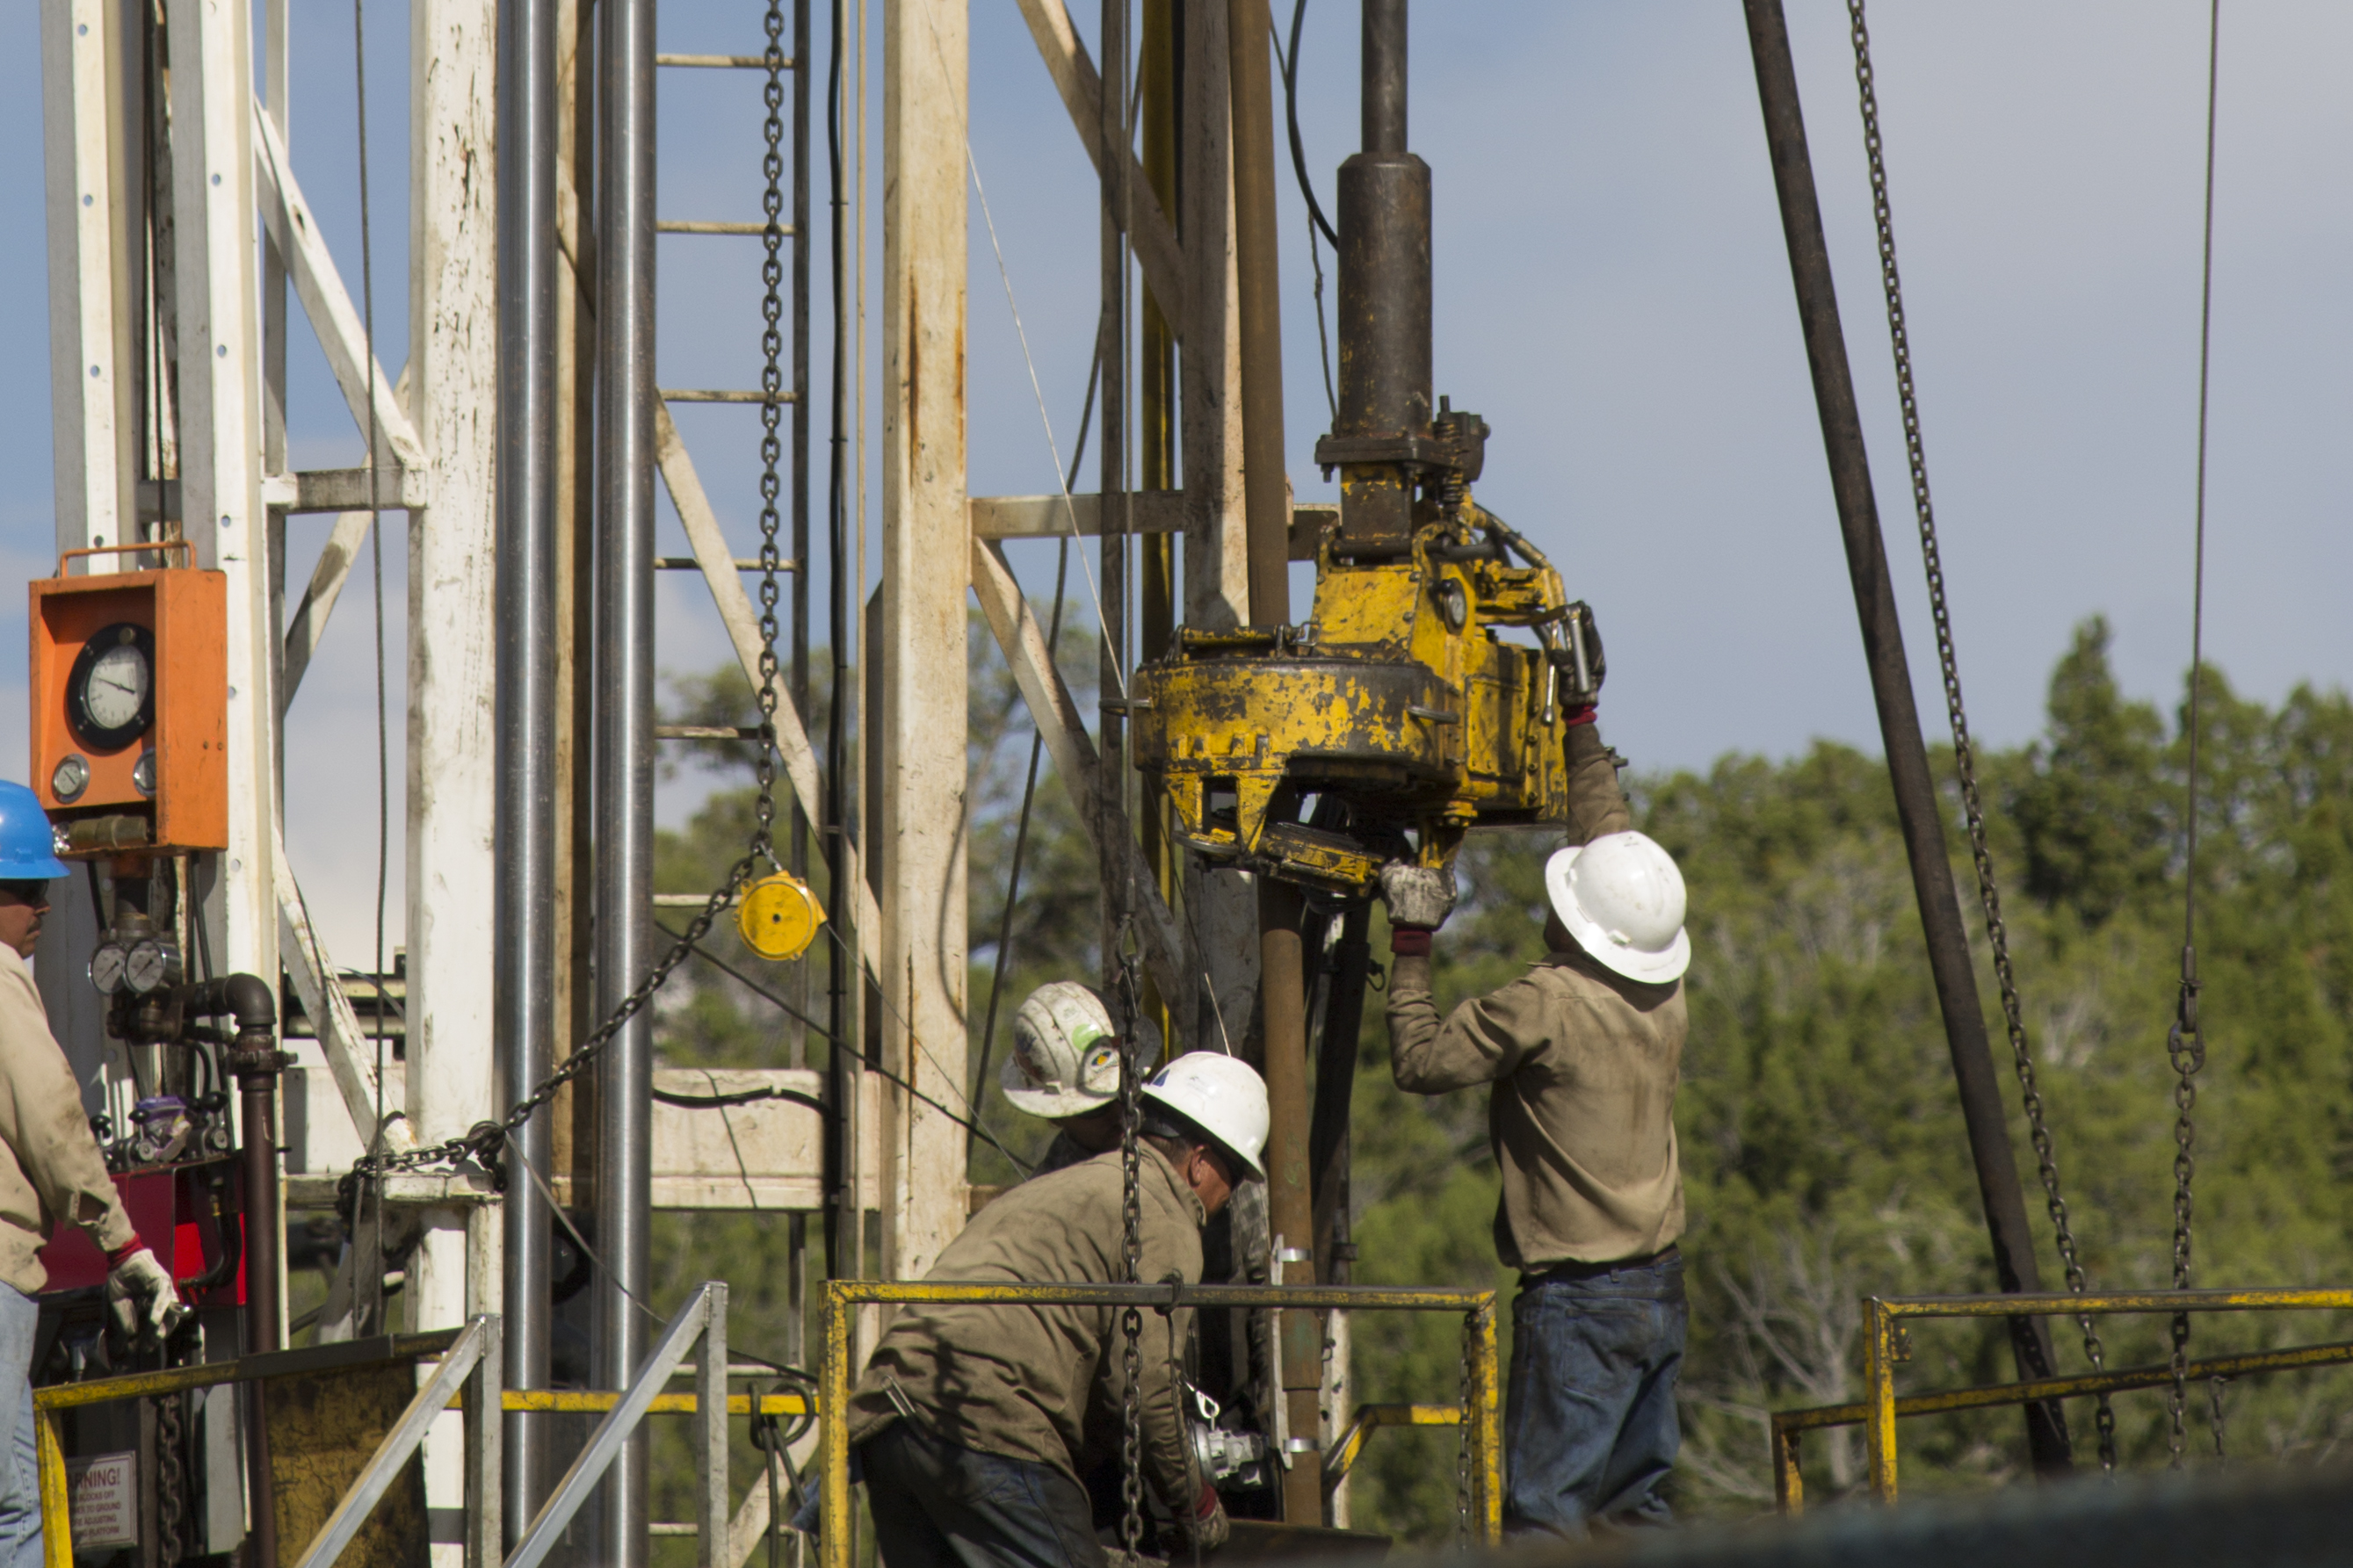
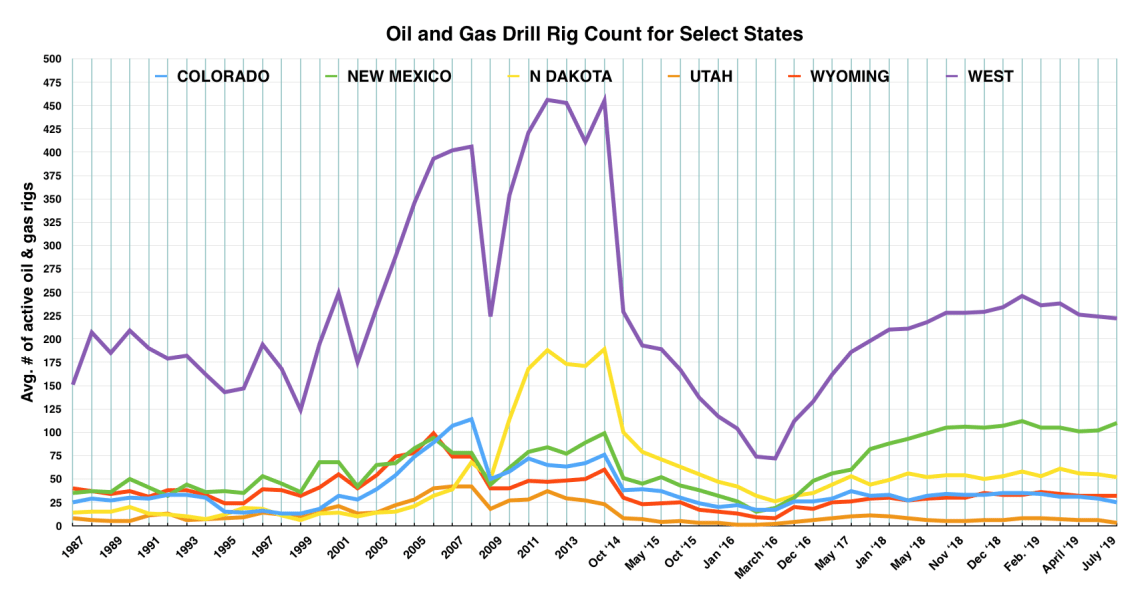
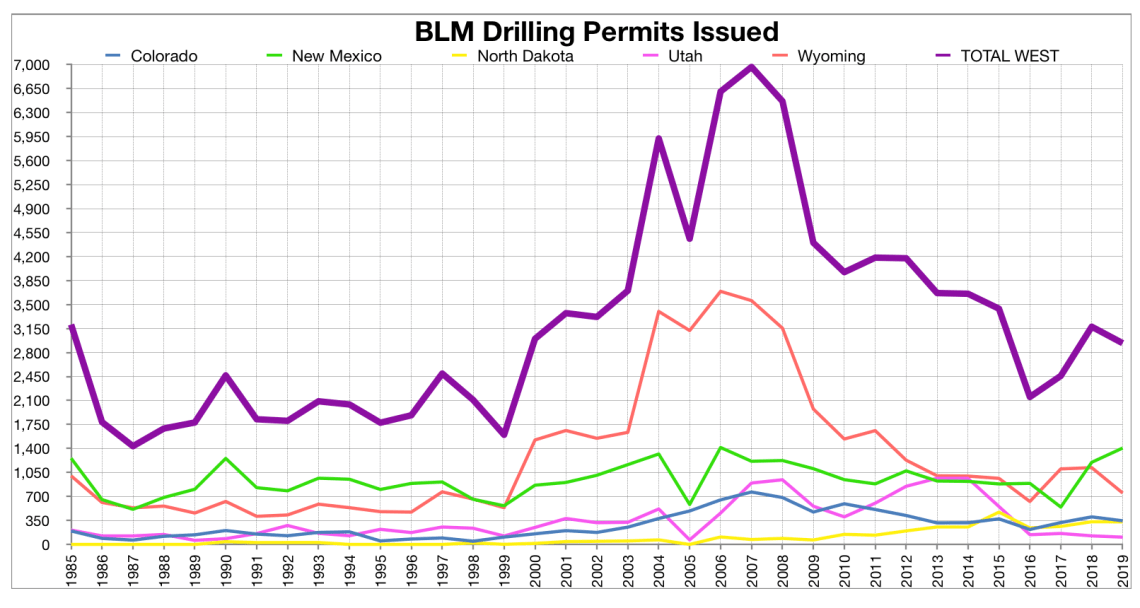
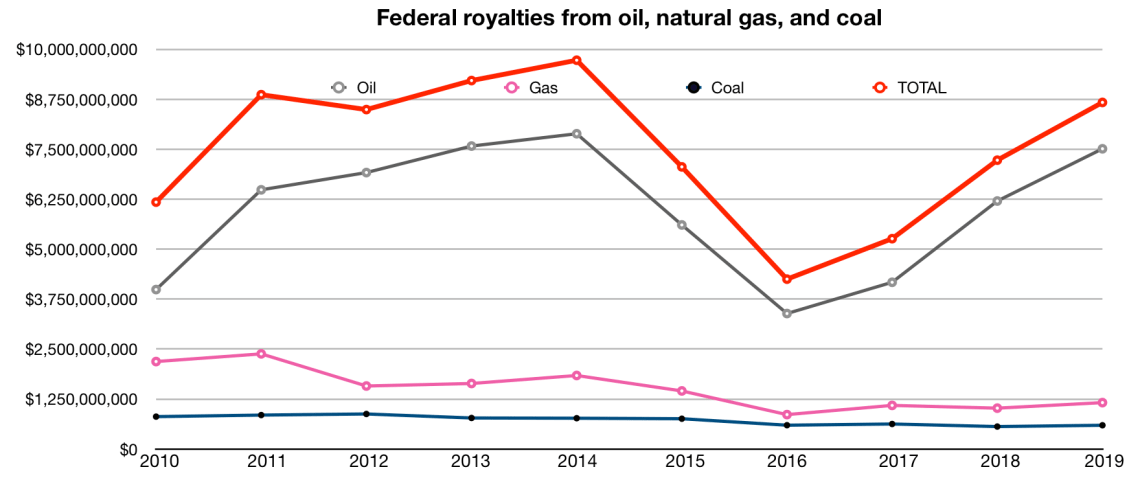
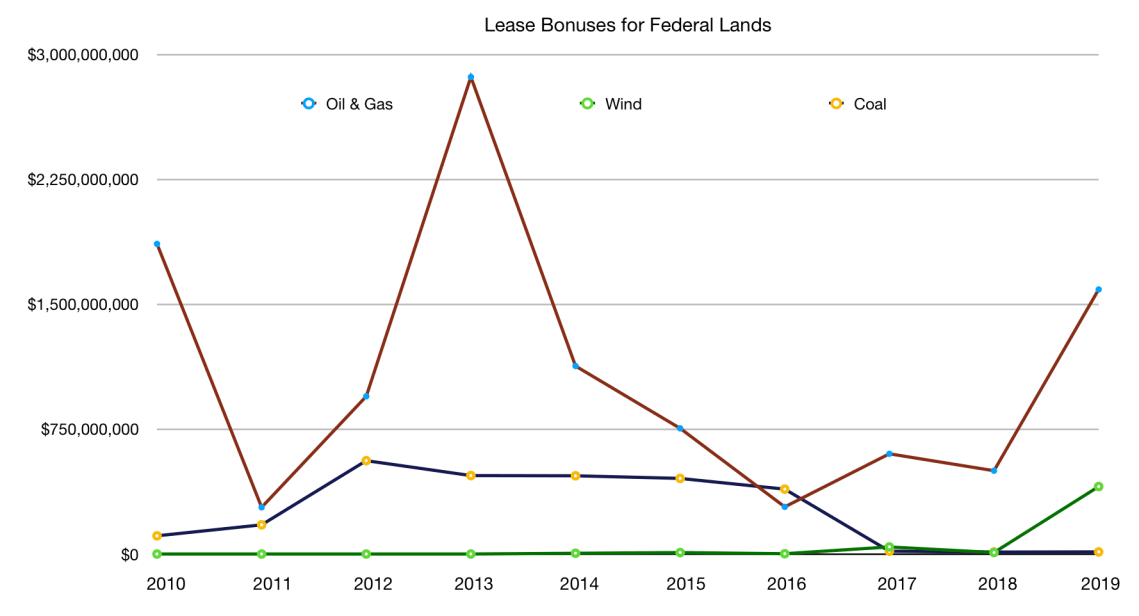
The most current and most accurate indicator of oil and gas development activity is the rig count. The drilling phase is the most labor-intensive, and drilling a single well employs dozens of people. Once the well starts producing, the number of jobs drops to just a handful. And drilling follows the price of the commodity. An operator won’t fork out millions to drill a well unless the oil or gas it produces will bring in a profit. When oil was fetching up to $150 per barrel, drilling went bonanzas in North Dakota, where operating costs are higher. But with the cost hovering around $60/barrel for the last several months, the rigs have targeted the less-expensive-to-drill Permian Basin in southeastern New Mexico. It’s also important to note that this chart counts all active rigs, whether they are operating on public, private, or tribal land. Data source: Baker Hughes. Infographic by Jonathan Thompson.A comparison of the above two graphs seems to reveal a mistake: In the top one, drilling seems to be centered in North Dakota, while in the bottom all the action’s occurring in Wyoming a few years earlier. It’s not a mistake. Much of the development in North Dakota occurs on non-federal land going for non-federal minerals, meaning the Bureau of Land Management does not have permitting jurisdiction. The drilling permitting surge in Wyoming in the mid-2000s was driven by high natural gas prices at the time. But natural gas prices crashed in 2008, putting a damper on development. Important note: Just because a company has a permit to drill does not mean they will necessarily drill the well. An analysis of permits vs. the number of wells “spud” (drilling was begun) during 2009-2018 revealed that while 37,000 permits were issued, only 23,000 were spud. Data source: Department of Interior. Graph: Jonathan ThompsonTrump administration officials are bragging about the big increase in royalty revenues since the “last year of the previous administration.” But total royalties from the three big commodities, oil, natural gas, and coal, were higher back in 2014. Why? Because both oil prices and production levels were high. Now, U.S. oil production is at record levels, but Trump can’t claim credit. A lot of that oil is coming from wells drilled during the previous administration. Data source: Department of Interior. Graph: Jonathan Thompson.This one’s interesting. Very interesting. When a company leases federal land for energy development it pays a bonus (usually a pathetically low amount) to secure the right to develop that land. Oil and gas is the big revenue generator, as expected, and high oil prices drove a leasing surge back in 2013. Leasing is increasing again, perhaps because companies are trying to secure land before the 2020 election, as the major Democratic presidential candidates have said they will freeze public land leasing for fossil fuels. That won’t make much of a difference for coal companies, however, which apparently are too busy dealing with bankruptcy to lease out new land for mining. Most interesting, however, is the surge in leasing for wind facilities over the past year. Data Source: Department of Interior. Graphic: Jonathan Thompson.
Journalist, editor and writer focusing on the Western United States and its landscapes, communities, and cultures. Creator of Land Desk. Author of "River of Lost Souls: The Science, Politics, and Greed Behind the Gold King Mine Disaster" (Torrey House Press 2018), "Behind the Slickrock Curtain" (Lost Souls Press 2020), and the forthcoming "Sagebrush Empire: A journey into the heart of the public land wars" (Torrey House 2021).
View all posts by Jonathan P. Thompson